Welcome to the Data Swamp: Navigating the Mess to Find Real Answers
Manufacturing data is scattered, disorganized, and inaccessible. Learn how to structure the chaos with knowledge graphs and turn your data swamp into actionable insights.
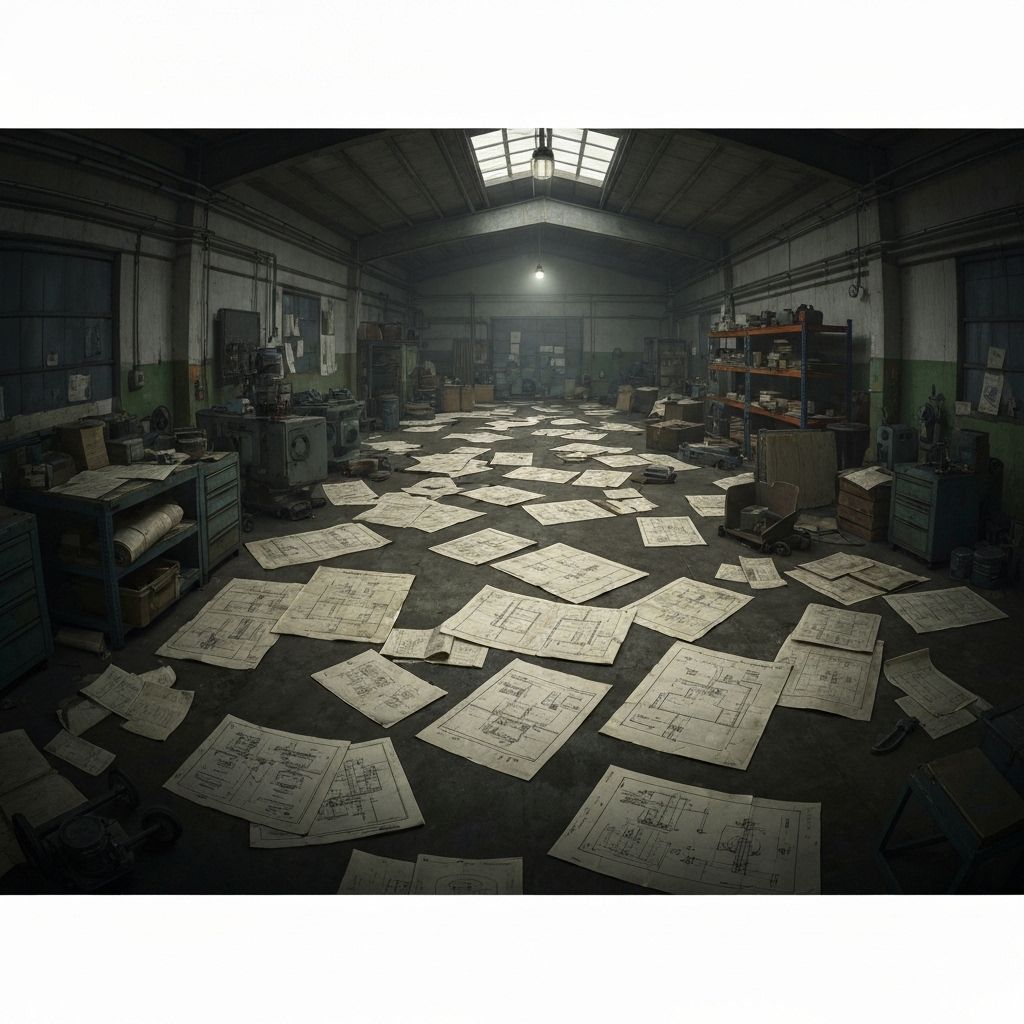
Imagine walking into a swamp. It's dark. It's wet. Every step reveals something concealed: a moss-covered inspection report, a PDF you forgot existed, maybe a project plan.
That's what most data infrastructure looks like in manufacturing. Critical information is scattered across too many formats and places. Maintenance logs in PDFs. Calibration data in Excel. Supplier emails buried in inboxes. CAD files in obscure formats no one has software for anymore. PowerPoint decks named "Final_FINAL_v3.pptx."
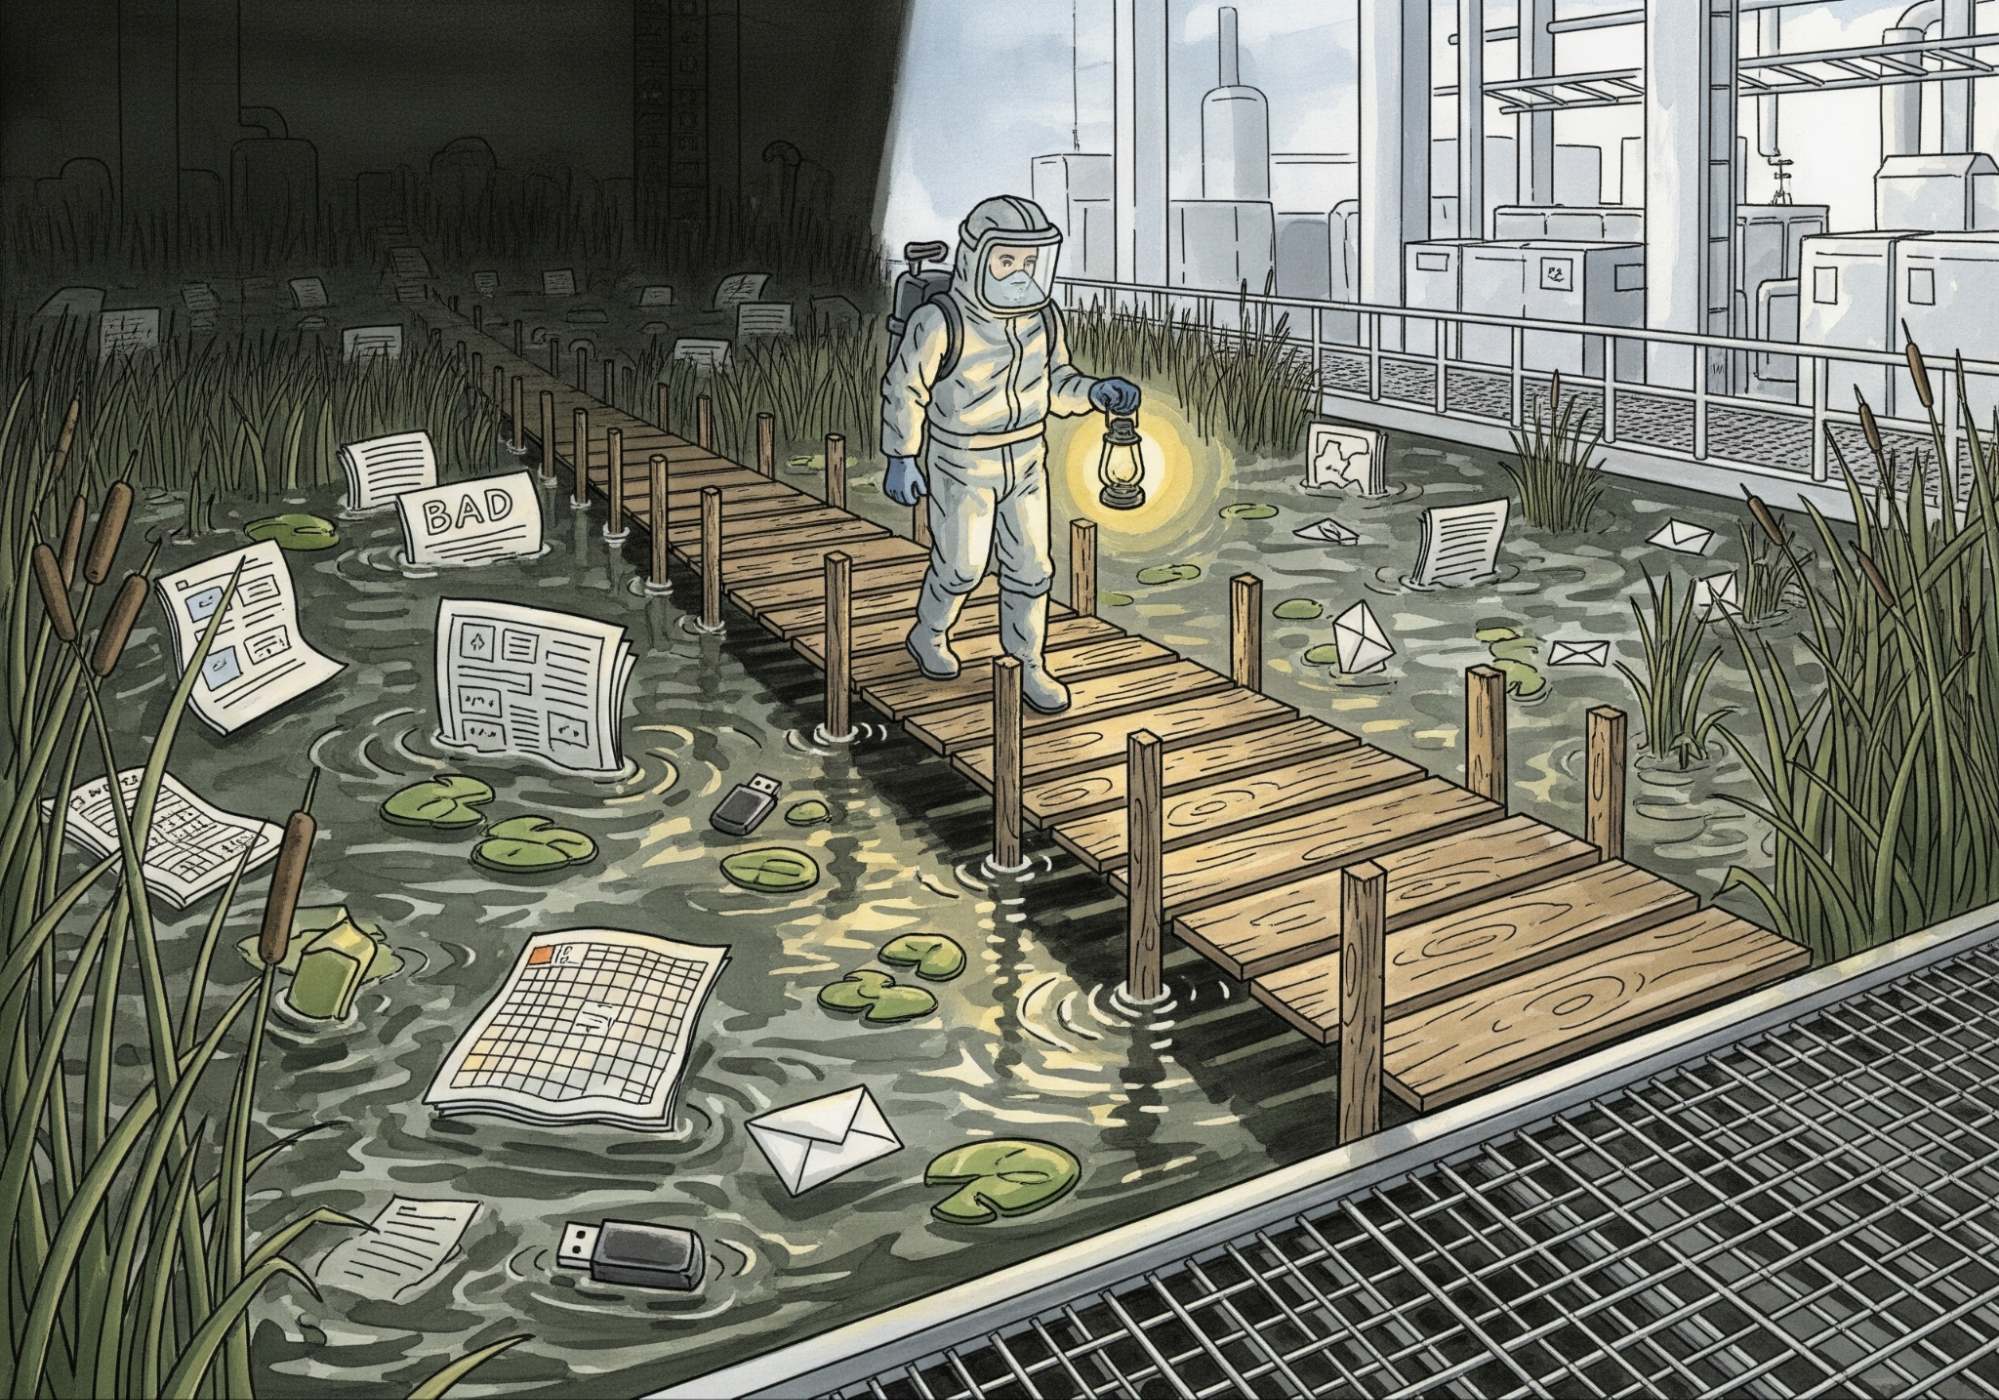
Teams try to "use AI" while most of their institutional knowledge is floating in this swamp, inaccessible and unlabeled. And much like an actual swamp, the deeper you go, the harder it is to find your way back out.
The context hidden within
Take a seemingly simple question: "Why did our scrap rate increase last quarter?" If we're going to answer that question, we'll need to take from a lot of different fields and factors. We'll have to comb through sensor logs or maintenance records or some obscure email thread you forgot about.
Each piece holds part of the answer. Individually, none give you the full picture. But together, they tell a story: the maintenance team replaced a motor, which ran hotter than spec, degrading the material from the new supplier, leading to excess scrap.
In manufacturing, every layer of information plays a role in explaining what happened and why. Signals, historical trends, precise measurements, other observations, all of it matters. Overlooking even one layer risks misreading the system entirely or missing the root cause altogether.
The goal is to extract context. To figure out what all this data actually means, how it relates, and how to use it when making decisions.
A structured approach: turning chaos into context
Let's be clear: you are not going to clean this up by hand.
There's too much of it. The data is too varied, too disorganized, and too spread out. You can't just hire a few interns, give them a spreadsheet, and hope for the best.
First, you have to stop thinking about the problem as a data storage issue and start thinking about data structure.
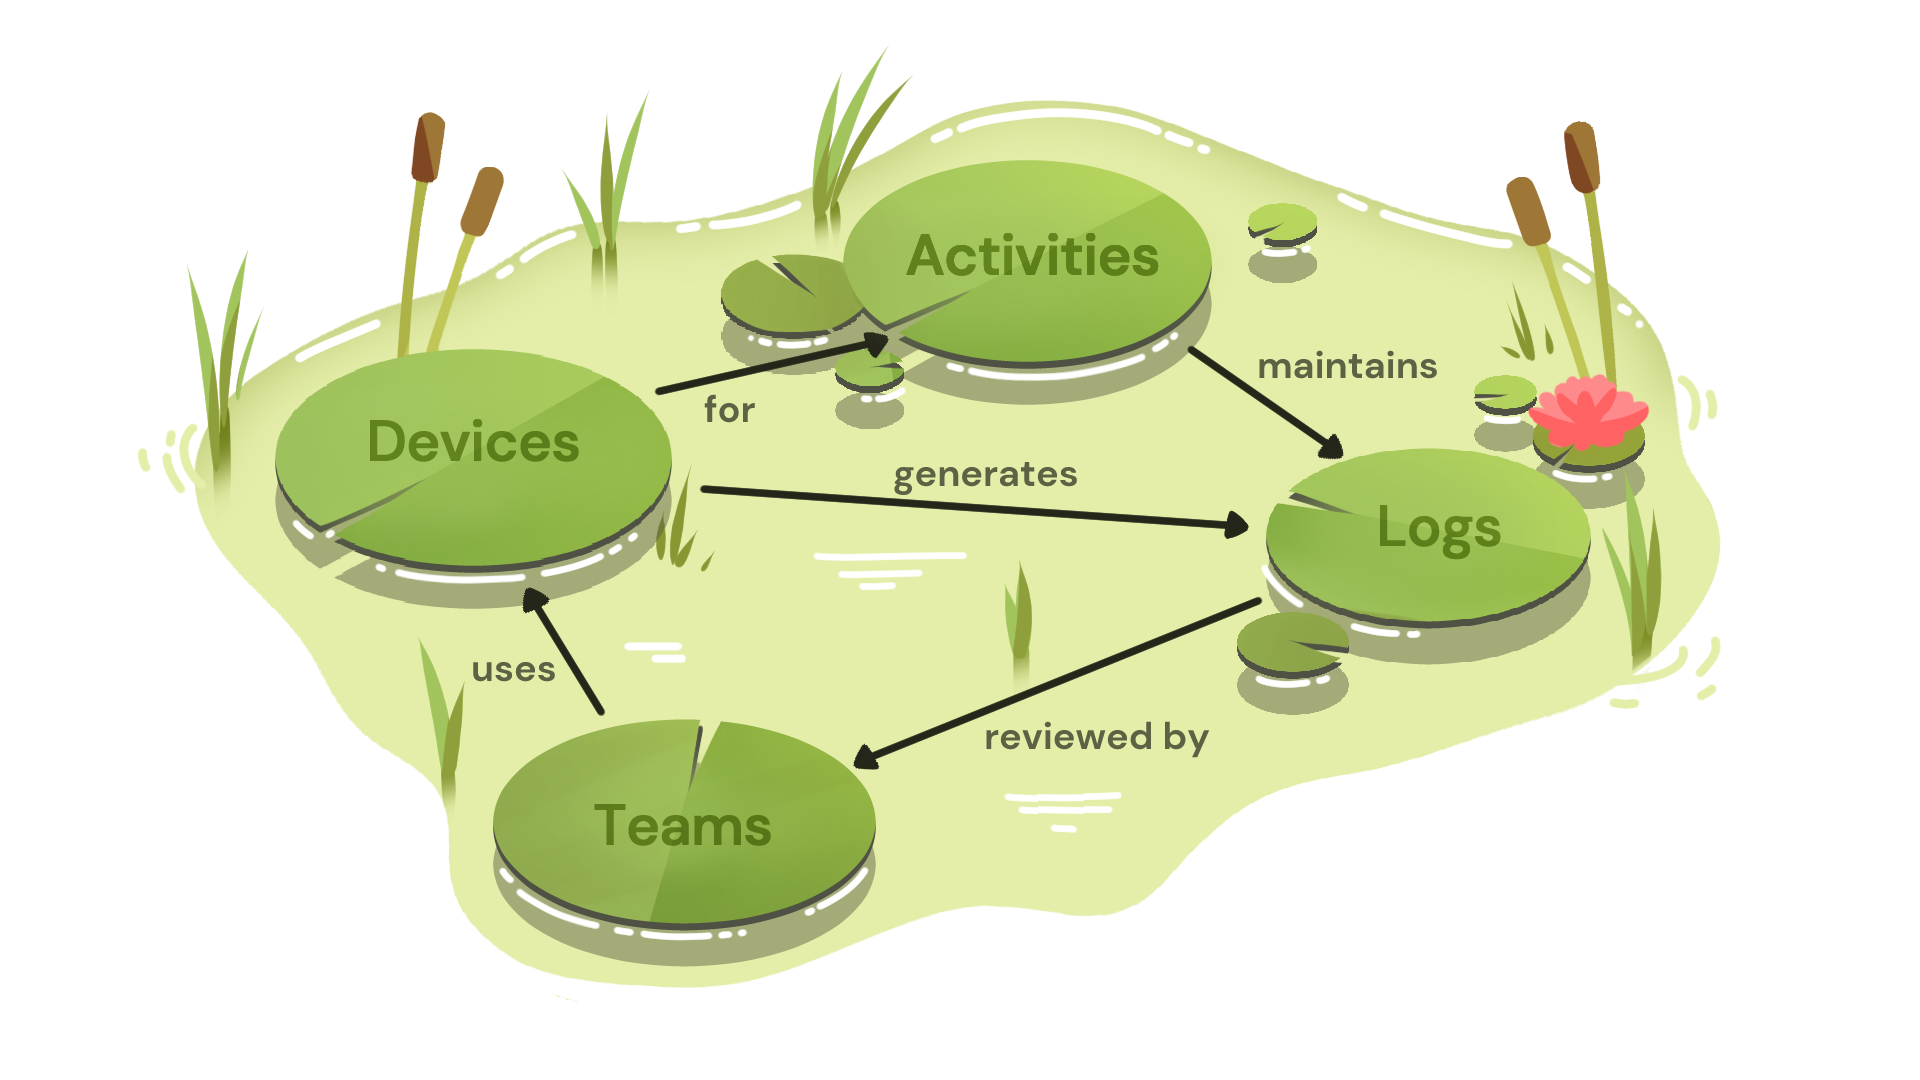
That means defining a shared set of "labels" that describe how your operation works. Labels like machines, processes, materials, documents, people, activities become the building blocks for understanding your data. Once you've defined these categories, you can begin sorting everything you have into them.
A PDF becomes a document tied to a specific process. A temperature reading becomes a sensor value linked to a particular device. A maintenance note becomes an activity tied to both a machine and a technician.
The next step is to connect the dots. It's not enough to know what something is, you need to know how it fits with the larger picture.
That fault log should link to the equipment that caused it, the team that responded, and the replacement part that was used. That energy audit should point to the zone it measured, the time period it covered, and the equipment it evaluated. You're organizing data and turning isolated records into a web of meaning.
This is where knowledge graphs come in.
Mapping the swamp: using knowledge graphs to connect the dots
A knowledge graph is just a way of showing relationships between things. At a basic level, it's made up of "nodes" (the things) and "edges" (the relationships). Those labels we talked about earlier (machines, processes, documents, people) become the types of nodes in your graph. They help define what each piece of data is, so you can treat a sensor reading differently from a maintenance task or a material spec.
Let's say you have a node labeled "Device," another labeled "Maintenance Activity," and another labeled "Technician." The edges then describe the relationships: this technician performed this activity on this device, at this time. The graph connects all of that together into a structure you can actually reason over.
That's how you drain the swamp; you chart it, label what's in it, and learn to navigate it with purpose.
You're never going to get rid of the mess completely. But with the right structure, the mess becomes usable. Information that used to be lost becomes findable. Disconnected dots become insights. And those mystery folders become part of the story.